
Running Pace Calculator
Planning a race or a training run comes down to three numbers — distance, time and pace — and knowing any two gives you the third. This calculator does that in miles or kilometres, produces a split table you can print as a wristband, and predicts what a recent race suggests you could run at other distances.
- Free to use
- No sign-up
- Runs in your browser
Quick answer
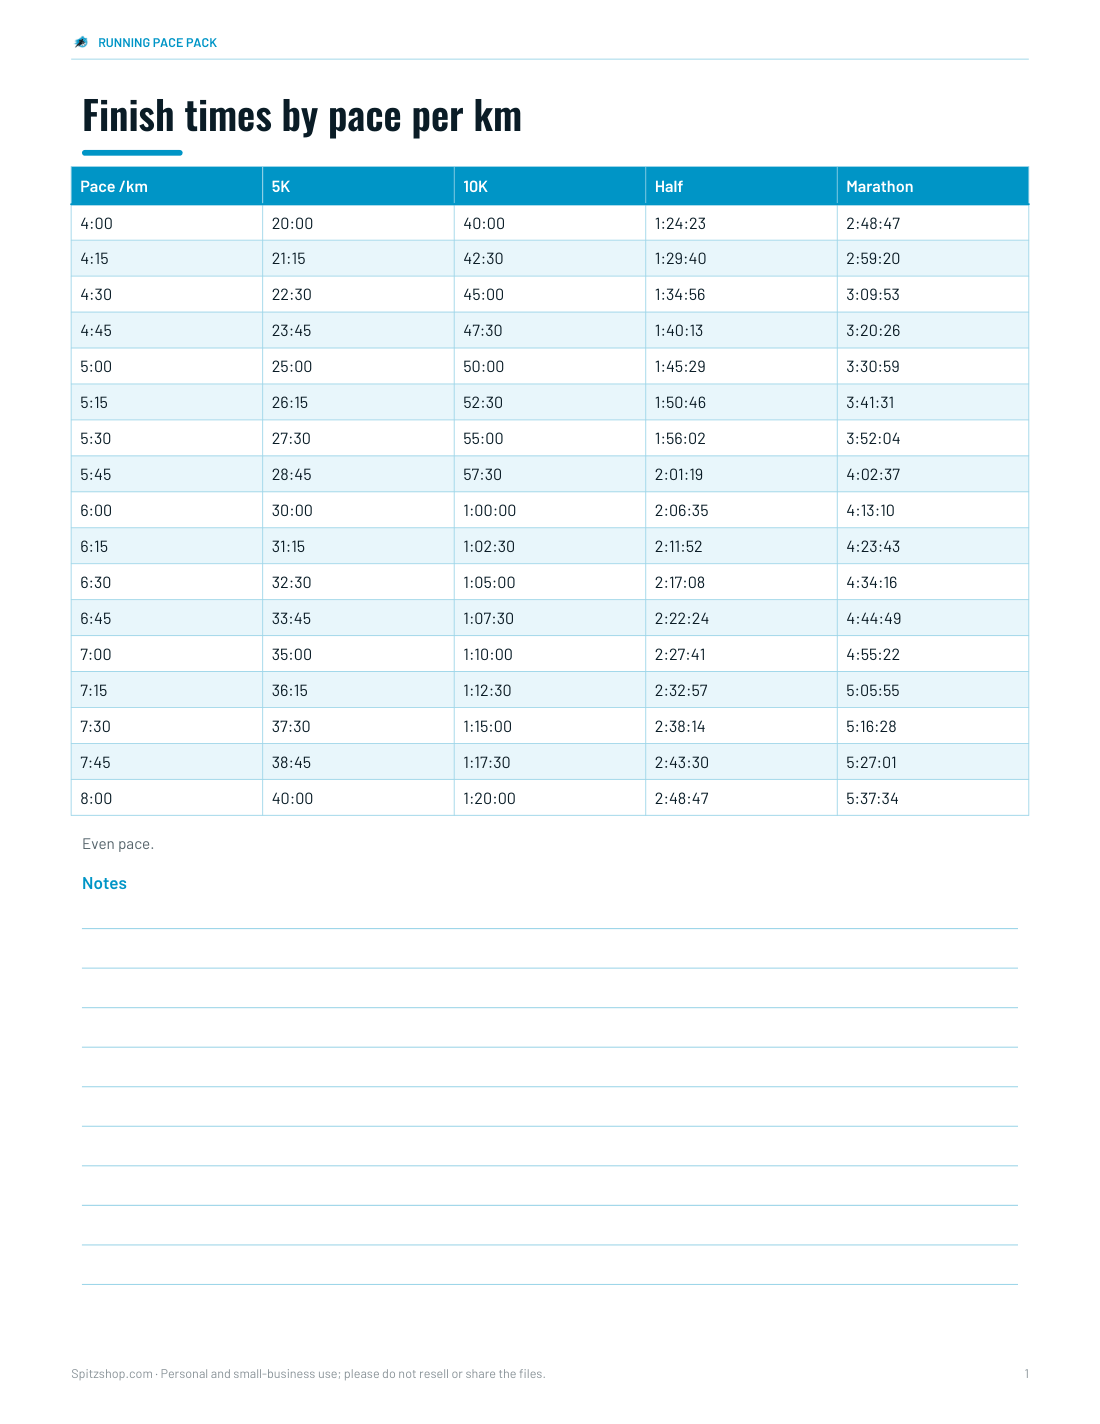
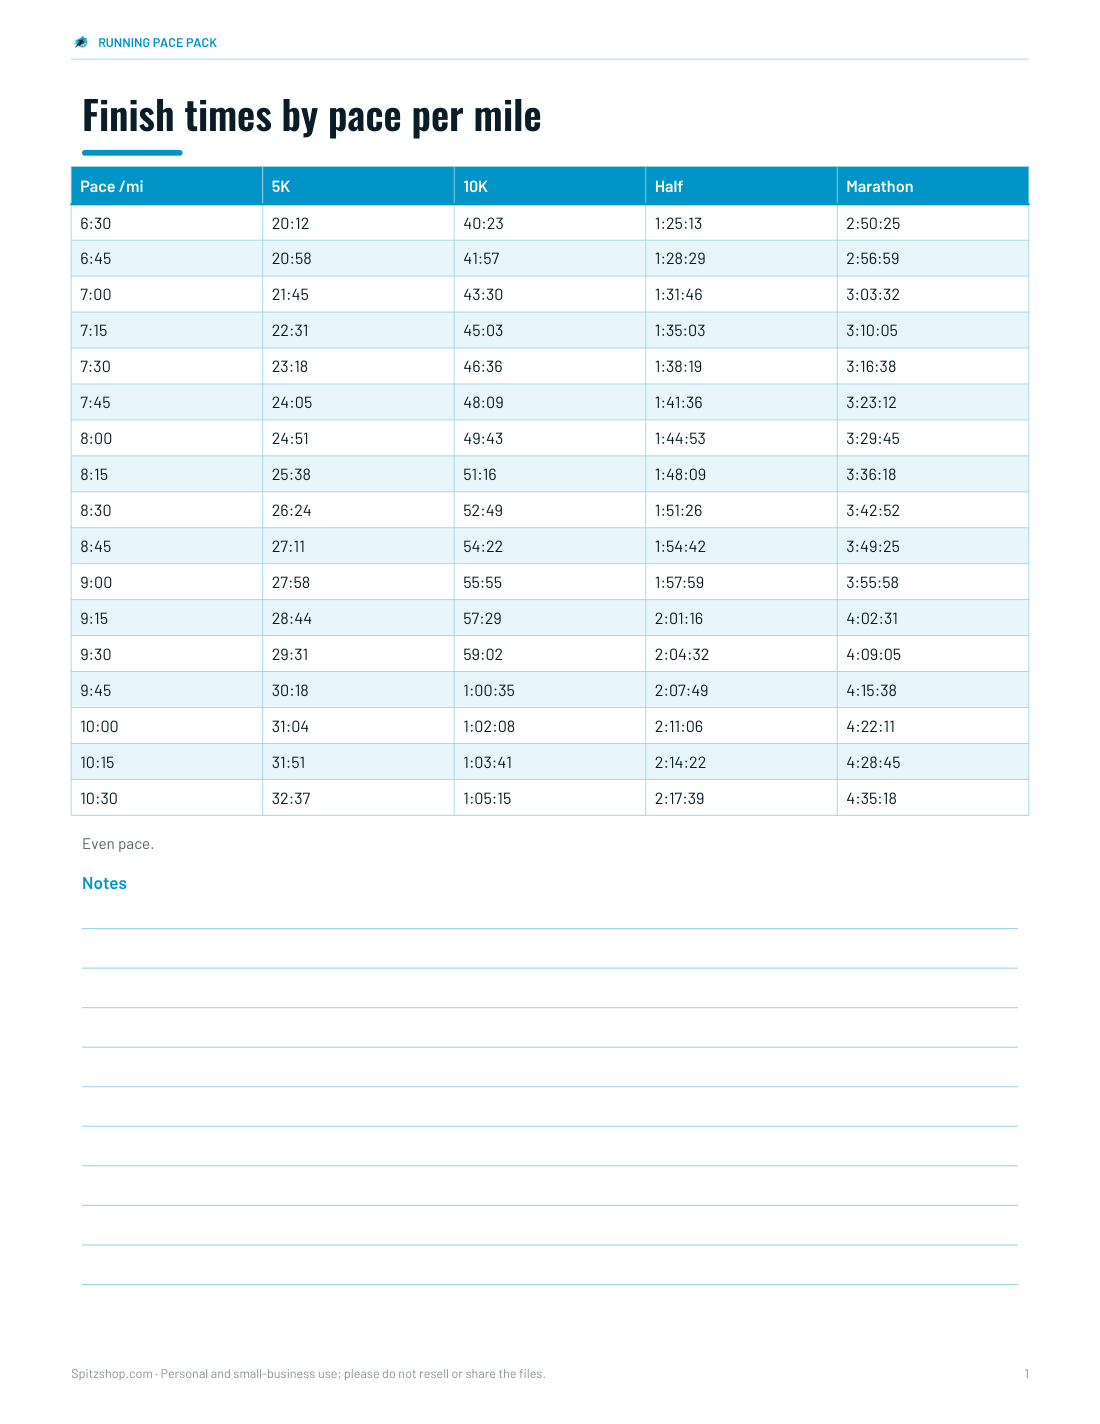
Running pace chart: pick your pace per mile or per kilometer, then read across to estimate finish times for common race distances. For US runners, pace per mile is shown first, with metric pace included. Use the calculator to enter any exact goal time, switch units, and print a split table or pace band.
Running pace calculator
Running Pace Pack
Printable pace charts for 5K to marathon (per km and per mile), pace band templates, an Excel training log and a race day checklist.
- Pace chart per km (PDF/XLSX)
- Pace chart per mile (PDF/XLSX)
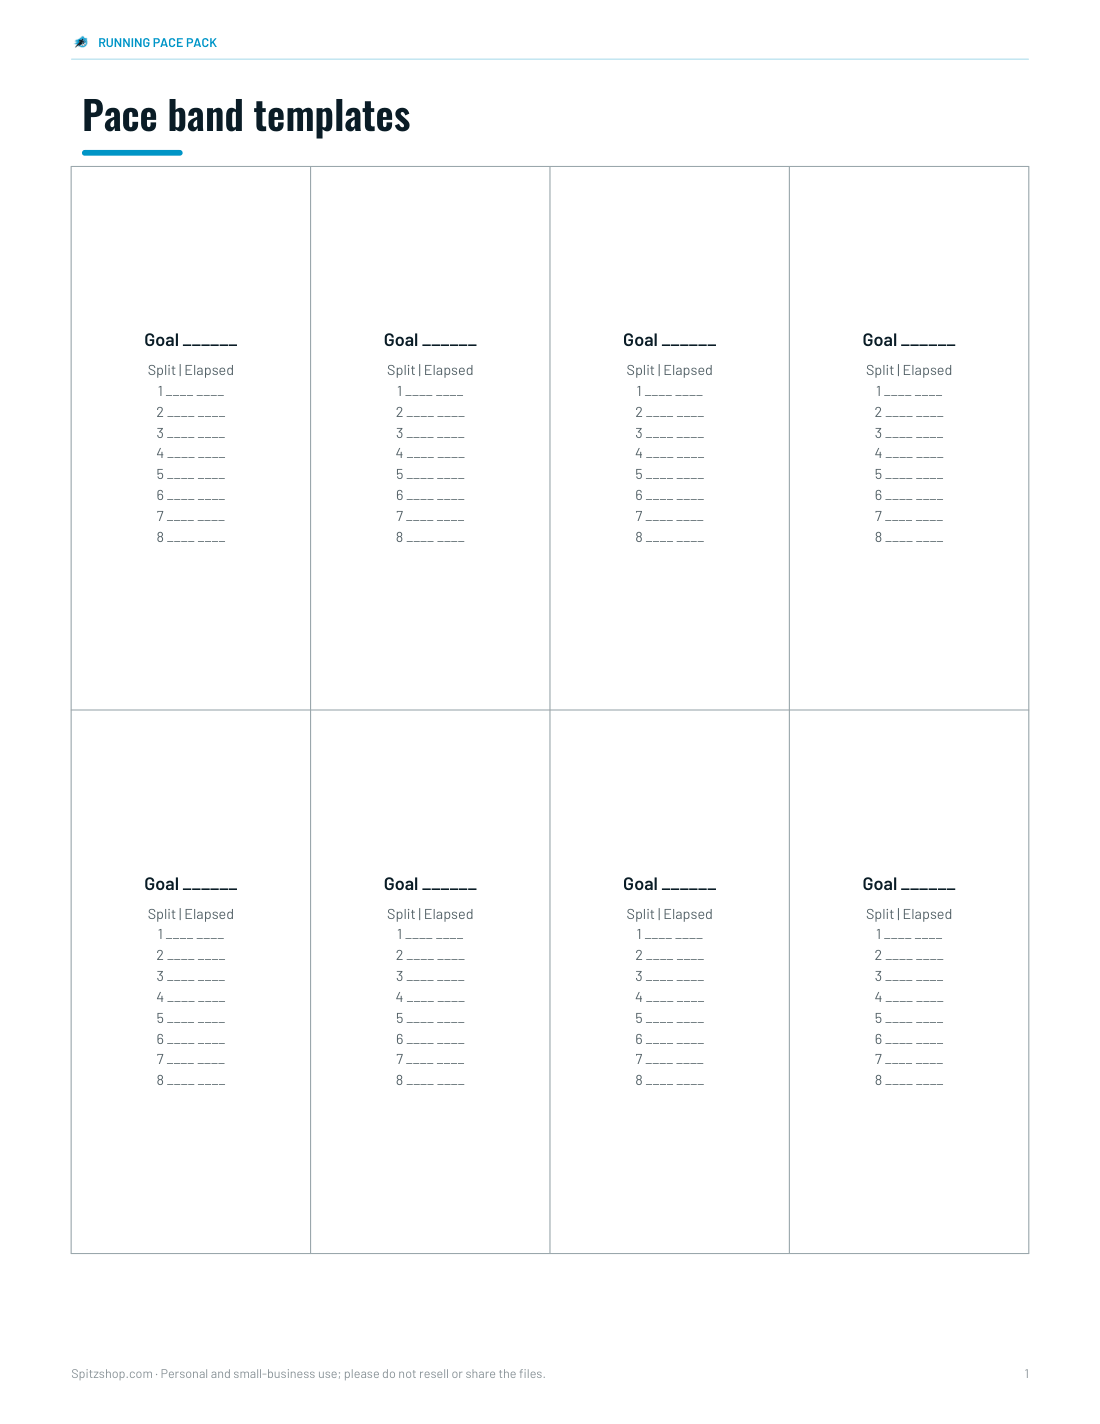
- Pace bands (PDF)
- Training log (XLSX)
- Race day checklist (PDF/DOCX)
Formats: PDF, XLSX, DOCX. Instant download after payment (link valid 72 hours, up to 5 downloads). AI-assisted: the templates were drafted with AI help and reviewed and laid out before publishing.
$5.00 USD, one-time 5 files · about $1.00 each
- Instant download
- 7-day refund
- Secure checkout by Stripe
7-day money-back guarantee. Full refund within 7 days of purchase, even after you download.
Free sample: Pace Chart Km (PDF, 70 KB)
Full refund within 7 days — see the refund policy and license.
Free printables
Single sheets you can print right now, no sign-up. The full pack adds every sheet in one download plus the editable files.
 Printable Pace Chart per Km
 Printable Running Pace Chart
 Printable Pace Band Templates
 Printable Running Training Log
 Printable Race Day Checklist
Running pace chart
Use these rounded finish times as a quick chart before entering exact values in the calculator.
| Pace/mi | Pace/km | 5K | Half | Marathon |
|---|---|---|---|---|
| 5:00 | 3:06 | 15:32 | 1:05:33 | 2:11:06 |
| 6:00 | 3:44 | 18:38 | 1:18:39 | 2:37:19 |
| 7:00 | 4:21 | 21:45 | 1:31:46 | 3:03:32 |
| 8:00 | 4:58 | 24:51 | 1:44:53 | 3:29:45 |
| 9:00 | 5:36 | 27:58 | 1:57:59 | 3:55:58 |
| 10:00 | 6:13 | 31:04 | 2:11:06 | 4:22:11 |
| 11:00 | 6:50 | 34:11 | 2:24:12 | 4:48:24 |
| 12:00 | 7:27 | 37:17 | 2:37:19 | 5:14:38 |
| 13:00 | 8:05 | 40:23 | 2:50:25 | 5:40:51 |
| 14:00 | 8:42 | 43:30 | 3:03:32 | 6:07:04 |
The pace formulas
| To find | Formula | Example |
|---|---|---|
| Pace | Time ÷ distance | 52:30 ÷ 10 km = 5:15 per km |
| Time | Pace × distance | 5:15 × 10 km = 52:30 |
| Distance | Time ÷ pace | 52:30 ÷ 5:15 = 10 km |
| Pace per mile from per km | Pace per km × 1.609 | 5:15/km = 8:27/mile |
| Speed | Distance ÷ time in hours | 10 km in 0.875 h = 11.4 km/h |
Work in seconds to avoid mistakes: 5:15 is 315 seconds; 315 × 1.609 = 507 seconds = 8:27.
Race distances
| Race | km | miles |
|---|---|---|
| 5K | 5 | 3.107 |
| 10K | 10 | 6.214 |
| Half marathon | 21.0975 | 13.109 |
| Marathon | 42.195 | 26.219 |
| 1 mile | 1.609 | 1 |
Even, negative and positive splits
Running each kilometre or mile at the same pace — even splits — is usually the most efficient strategy on a flat course. A negative split, where the second half is slightly faster than the first, is how many records are set: it avoids going out too fast and running out of energy. A positive split (slowing down) is the most common way races go wrong. The calculator can build a split table with the second half 2% faster or slower so you can see the difference in each split.
Race time predictions
The calculator uses Pete Riegel’s formula, T₂ = T₁ × (D₂ ÷ D₁)^1.06, which extends a recent race result to other distances with a small allowance for slowing over longer races. A 52:30 10K predicts roughly 25:10 for 5K, 1:55:50 for the half marathon and about 4:01 for the marathon. Treat the marathon prediction with caution: without long runs and marathon-specific training, most runners finish slower than the formula suggests.
Worked example
A runner finishes a 10K in 52 minutes 30 seconds. That is a pace of 5:15 per km (8:27 per mile) and an average speed of 11.4 km/h. For their next 10K they aim for a negative split: the calculator shows the first five kilometres at about 5:18 and the last five at about 5:12, still totalling 52:30. They print the split table as a pace band to wear on their wrist and check each kilometre marker against it.
Training paces
| Run type | Relative to 10K race pace | Purpose |
|---|---|---|
| Easy / recovery | About 60–90 s per km slower | Aerobic base, recovery |
| Long run | About 45–75 s per km slower | Endurance |
| Tempo / threshold | About 10–20 s per km slower | Sustained speed |
| Intervals | Around 5K pace | Speed and VO₂max |
| Strides | Fast but relaxed, 20 s | Form and turnover |
These are rough guides used in many training plans; heart rate, perceived effort and your coach’s advice are better guides day to day.
Pacing on race day
- Start slightly slower than goal pace for the first kilometre or mile; crowds and adrenaline make it easy to go out too fast.
- Settle into goal pace and check each split against your pace band.
- On hills, run by effort rather than pace, and expect to regain time on the downhill.
- Adjust for heat and wind: warm days can slow runners by several seconds per kilometre.
- If you feel strong after halfway, gradually increase the pace for a negative split.
GPS watches drift in tall-building areas and under trees; the official course markers are more reliable than the watch distance.
Treadmill pace conversions
| Treadmill speed | Pace per km | Pace per mile |
|---|---|---|
| 8 km/h | 7:30 | 12:04 |
| 9 km/h | 6:40 | 10:44 |
| 10 km/h | 6:00 | 9:39 |
| 11 km/h | 5:27 | 8:47 |
| 12 km/h | 5:00 | 8:03 |
| 13 km/h | 4:37 | 7:26 |
| 14 km/h | 4:17 | 6:54 |
| 15 km/h | 4:00 | 6:26 |
Many runners set a 1% incline on a treadmill to better match the effort of running outdoors.
Building towards a goal time
A realistic goal usually comes from a recent race or time trial: enter it, check the predictions, and aim for an improvement of a few percent over a training block of 8–16 weeks. Build weekly distance gradually, include one quality session (tempo or intervals) and one long run each week, and keep most runs easy. The training log in the pack helps you see whether easy runs are truly easy and whether pace at the same effort is improving.
The running pack
The optional pack includes printable pace charts for 5K to marathon (per km and per mile), pace band templates, an Excel training log with weekly mileage and pace trends, and a race day checklist. The calculator on this page is free.
AI-assisted content
This page was drafted with AI assistance and reviewed before publishing.
Frequently asked questions
How do I read a running pace chart?
Find your pace per mile or per kilometer, then move across to the race distance. The cell is the estimated finish time if you hold that pace evenly.
Do I need a mile pace chart or a km pace chart?
In the US, most runners use minutes per mile, but many races and workouts also use kilometers. A chart with both avoids conversion mistakes.
Can I use the pace chart for treadmill runs?
Yes, if you match the treadmill speed to the equivalent pace. Treadmill effort can feel different, and many runners use about a 1% incline to approximate outdoor running.
How do I calculate my running pace?
Divide your time by the distance: 52:30 for 10 km is 5:15 per km.
What is a good 5K pace?
It varies hugely with age and experience; many recreational runners run between about 5 and 7 minutes per km.
How do I convert pace per km to pace per mile?
Multiply by 1.609.
What is a negative split?
Running the second half of a race faster than the first.
How accurate are race predictions?
Reasonably good between similar distances; often optimistic for the marathon.
Can I print a pace band?
Yes — use Print pace band under the split table.
What pace is a 2-hour half marathon?
About 5:41 per km or 9:09 per mile.
What pace is a 4-hour marathon?
About 5:41 per km or 9:09 per mile — the same pace as a 2-hour half.